A solid understanding of the latest social media demographics is the cornerstone of any social media strategy. As the popularity of various platforms waxes and wanes, the savviest marketers will spot new opportunities to reach target audiences on the platforms where they are most likely to build lasting relationships.
Bookmark this page as your one-stop source for the most useful demographics for every social platform to access every time you’re crafting a strategy or a report, or simply benchmarking your own audience.
Bonus: Download a free guide that reveals how to increase social media engagement with better audience research, sharper customer targeting, and Hootsuite’s easy-to-use social media software.
General social media demographics
1. As of 2023, the number of social media users worldwide was 4.89 billion. That’s more than half of the entire population of earth.
2. Globally, people spend an average of 2 hours and 26 minutes per day using social media.
3. Users in Brazil are spending the most time on social media: 3 hours and 49 minutes per day.
4. 59.9% of the world’s social media users live in the Asia-Pacific region. 10.5% live in Latin America, 9.2% in the Middle East and Africa, 7.1% in Central and Eastern Europe, 6.7% in North America, and 6.7% in Western Europe.
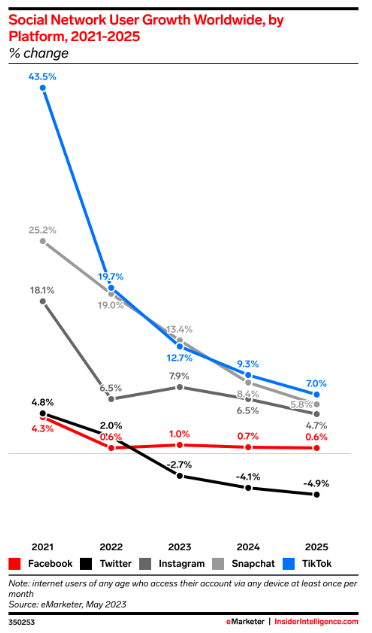
5. Asia-Pacific will also see the greatest social network user growth in 2023 at 2.7%.
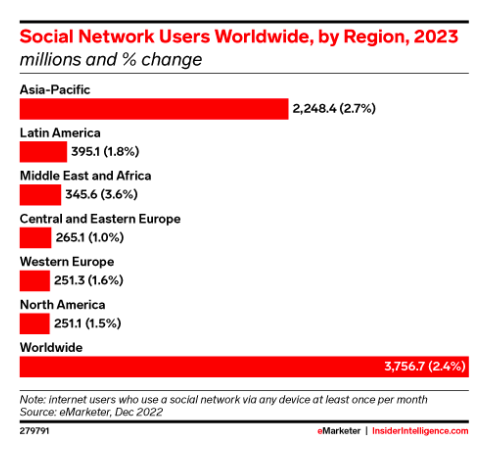
Source: eMarketer
6. The Philippines is the country with the greatest social media penetration among internet users at 98.6%.
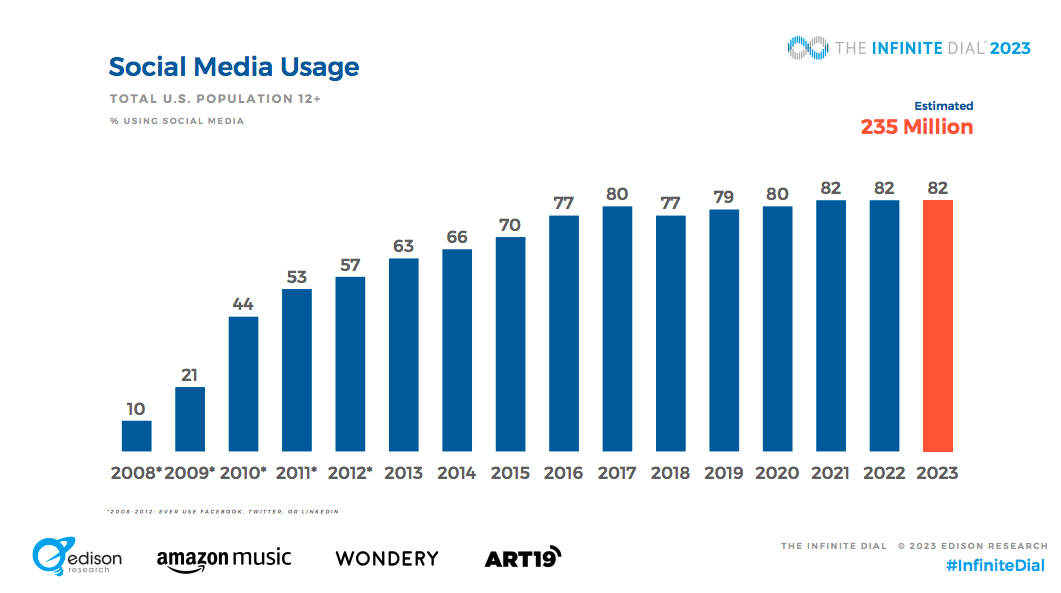
7. 82% of the total U.S. population aged 12 and up is using social media. That’s an estimated 235 million people.

Source: Edison Research
8. 40% of social media users follow influencers, and 30% have made a purchase after seeing an influencer post.
9. Women aged 18-29 are the most likely to make purchases based on influencer content (50%).
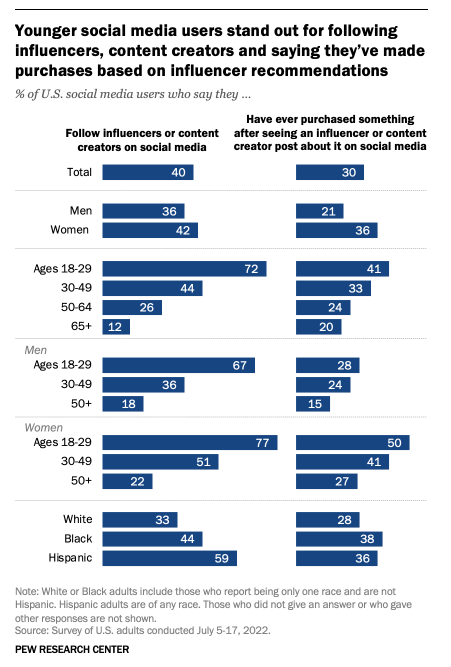
Source: Pew Research Center
10. The average annual U.S retail social commerce sales per buyer will be $641 in 2023. That’s expected to grow to $938 by 2025.
11. 92% of Internet users aged 16 to 64 visited or used social networks in the past month.
12. 45% of U.S. adults aged 65+ use social media. That’s a 400% increase since 2010. 84% of those aged 18-29 use social media, followed by 81% of those aged 30-49.
13. 50% of Internet users aged 16 to 24 use social networks for brand research, compared to 46% who use search engines.
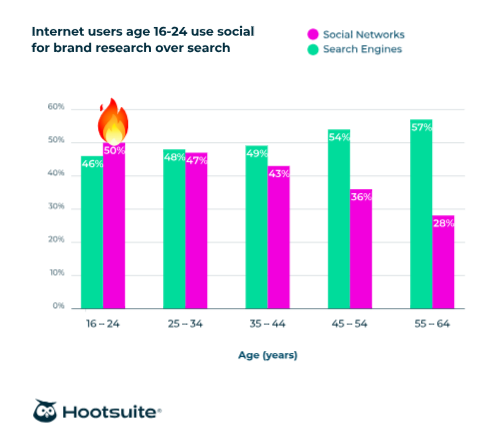
Source: Hootsuite Social Trends Report
Facebook demographics
14. Facebook has over 3 billion monthly active users.
15. The daily active user count is 2.064 billion.
16. Daily active users account for 68% of Facebook’s monthly active users.
17. Facebook users spend an average of 3.8 hours per week on the app.
18. 24.5% of all Facebook users are aged 45 and older.
19. 49.3% of all Facebook users are ages 25 to 34.
20. Only 32% of American teenagers use Facebook. That’s down from 71% in 2014-15.
21. 73% of Americans aged 35 to 54 use Facebook, compared to 56% of Americans aged 55+ and 55% of Americans aged 12-34.
22. Facebook will have 65.7 million U.S. social commerce buyers in 2023.
23. 56% of Facebook users identify as male, and 44% identify as female. Male users ages 25 to 34 continue to make up the biggest demographic of Facebook users.
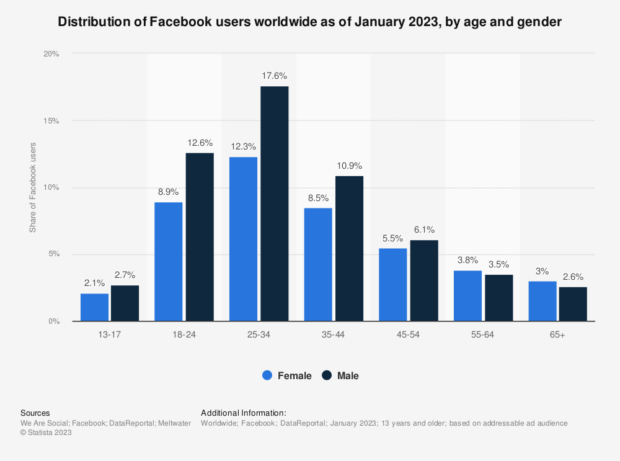
Source: Statista
24. India has the most Facebook users in the world, with more than 314 million users.
25. After India, the countries with the most users in the world are: the USA (175 million), Indonesia (120 million) and Brazil (109 million).
26. In the U.S., 73% of college graduates use Facebook.
27. Facebook is the #1 social platform to keep up to date with news and current events and to message friends and family. However, note that Meta is currently blocking news sites in Canada, so this does not (for now) apply to the Canadian market.
28. 57% of B2B marketers used Facebook in the last year.
29. Facebook remains the most popular social network, reaching 54.6% of social media users worldwide in 2023. It’s also the most popular social network in the United States, where it’s used by 61% of the population aged 12+.
Read more: Here are even more interesting Facebook demographics to help your brand with your social media strategy.
Instagram demographics
30. Instagram has more than 2 billion monthly active users.
31. Instagram is the most-used social network (72%) by American social media users aged 12 to 34. It’s second among all U.S. social media users aged 12+ (44%), behind Facebook.
32. Instagram will have 43 million U.S. social commerce buyers in 2023.
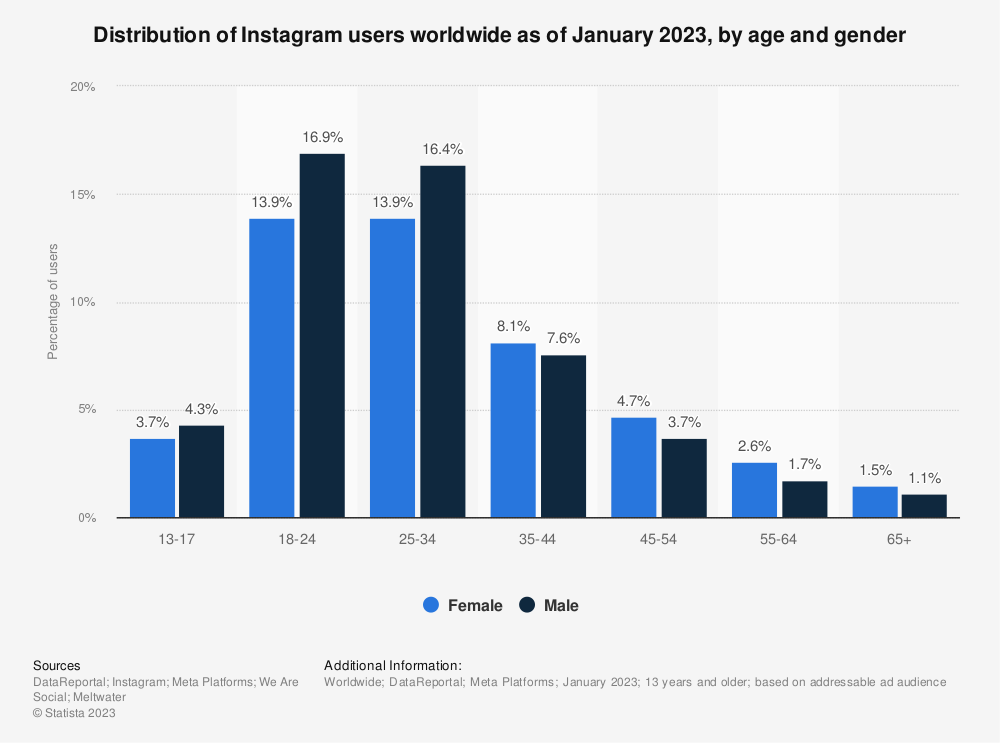
33. As of January 2023, 51.7% of all Instagram users worldwide are male.
34. 69.1% of global Instagram users are under the age of 35.

Source: Statista
35. 62% of teens in the U.S. use Instagram.
36. India has the most Instagram users in the world, with 230 million users as of January 2023.
37. Following India, the countries with the most Instagram users in the world are the U.S. (143 million), Brazil (113 million), Indonesia (89 million) and Turkey (47 million).
38. Instagram is the #1 social platform to follow or research brands and products and to post or share photos or videos.
39. 52% of B2B marketers used Instagram in the last year.
Read more: If your business relies heavily on Instagram, check out this post for 34 essential Instagram stats.
X (formerly Twitter) demographics
40. Twitter.com is the 5th most visited website globally.
41. X has 541 million monthly active users.
42. The average user spends just over 5 hours a month on Twitter. Users in Argentina spend the most time on the app per month (more than 8 hours).
43. 62.9% of U.S. Twitter users identify as male, and 37.1% identify as female.
44. X is used by 27% of Americans aged 12+, making it the 5th most popular social media platform in the USA.
45. 23% of U.S. teens use X.
46. 38% of Americans aged 12-34 use X, compared to 28% of Americans aged 35 to 54 and 15% of Americans aged 55+.
47. 88% of X users are also on Instagram.
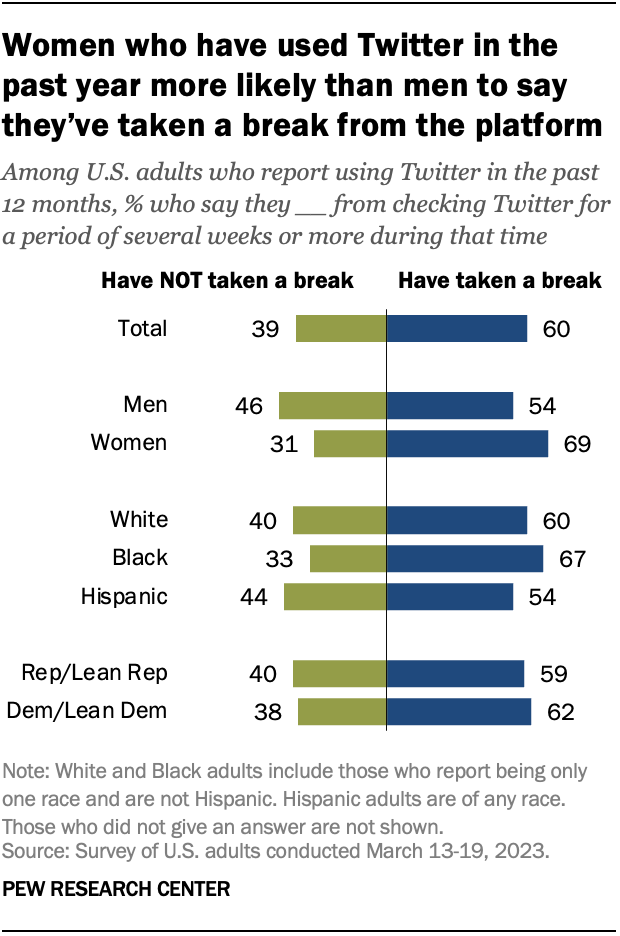
48. 60% of U.S. adults who have used X in the last year have taken a break of several weeks or more from the platform at some point during that time.
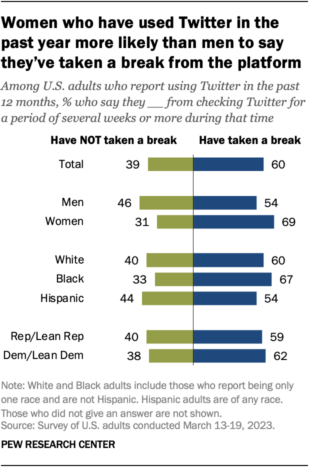
Source: Pew Research Center
49. 39% of B2B marketers used X in the last year.
Read more: Find more informative X statistics to help drive your brand’s social media marketing strategy.
LinkedIn demographics
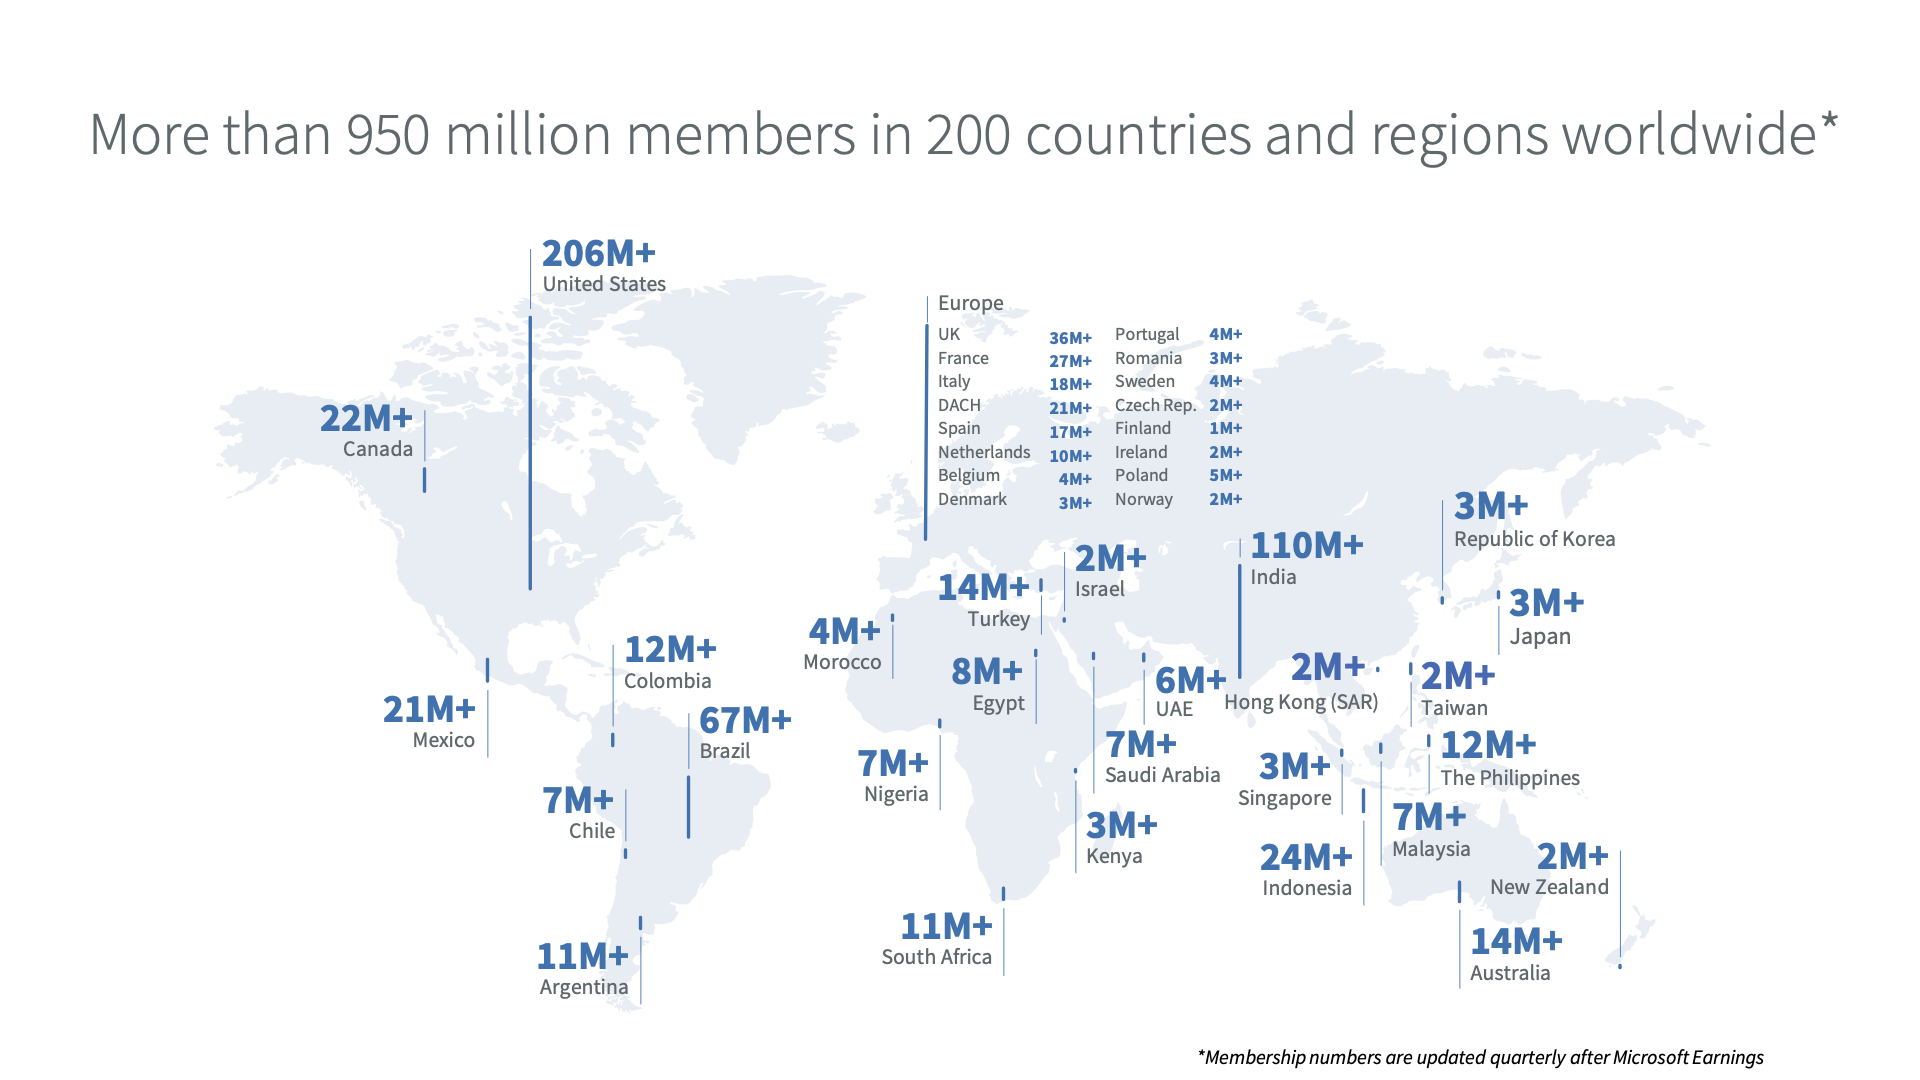
50. There are more than 950 million LinkedIn members worldwide.
51. 61 million people use LinkedIn each week to search for jobs — and 8 people are hired each minute.
52. 63 million companies are listed on LinkedIn.
53. 43.7% of users are female; 56.3% are male.
54. 60% of all LinkedIn users worldwide are ages 25 to 34. The next biggest user base is the 18 to 24 age group, making up 21.7%.
55. In the USA, 26% of Americans Internet users aged 12+ use Linkedin.
56. 35% of Americans aged 35 to 54 use LinkedIn, compared to 29% of Americans aged 12 to 34 and 14% of Americans aged 55+.
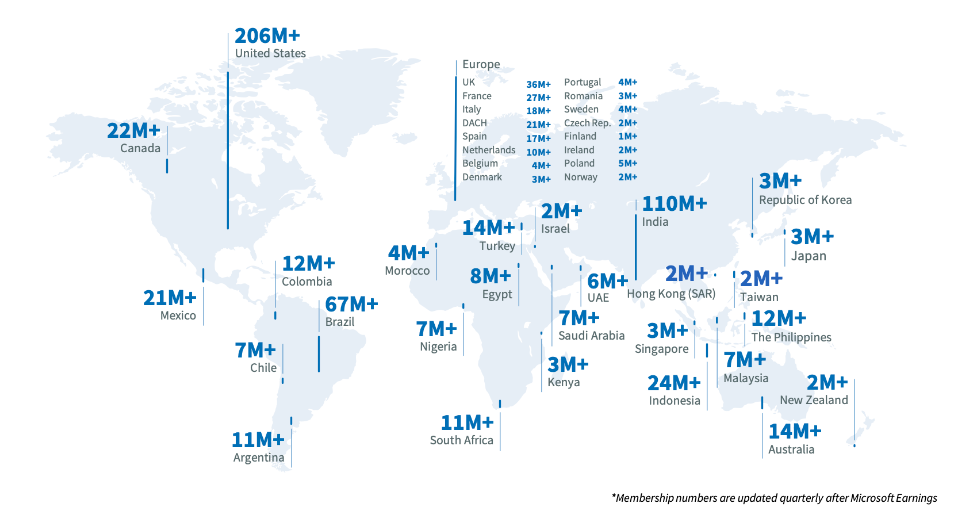
57. The country with the largest LinkedIn audience is the USA, at 206 million users.

Source: LinkedIn
58. That said, 75% of the LinkedIn audience is located outside the United States.
59. After the USA, the countries with the most LinkedIn members are India (110 million), Brazil (67 million), and the UK (36 million).
60. As of January 2023, Bermuda has the highest LinkedIn audience reach with a reach of 102.49%.
61. 50% of U.S. adults who earn over $75,000 dollars a year use LinkedIn.
62. Social media was the #3 skill added to LinkedIn profiles in 2022, compared with #8 in 2021.
63. LinkedIn is the top social platform for B2B marketers, with 80% having used it in the last year.
Read more: To get an even better idea of social media demographics for this platform, check out the top LinkedIn demographics that matter to social media marketers.
TikTok demographics
64. TikTok has approximately 834 million global monthly users.
65. TikTok is predicted to see the greatest user growth worldwide of all social platforms starting in 2024, at 7.0%.
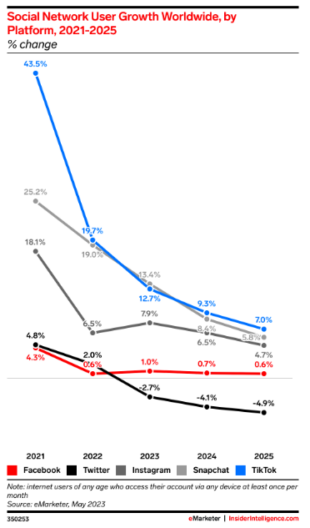
Source: eMarketer
66. TikTok has surged in the public consciousness. While only 64% of the U.S. population had heard of the app in 2020, 94% are now aware of it.
67. TikTok will have 33.3 million U.S. social commerce buyers in 2023. It surpassed Pinterest on this front for the first time in 2022.
68. The average U.S. adult TikTok user spends roughly 55.8 minutes per day on the app.
69. 17% of American men use TikTok, compared to 24% of American women.
70. In the USA, 67% of Americans aged 18 to 19 use TikTok, along with 56% of those aged 20 to 29. Of Americans aged 60 to 64, 16% use the platform.
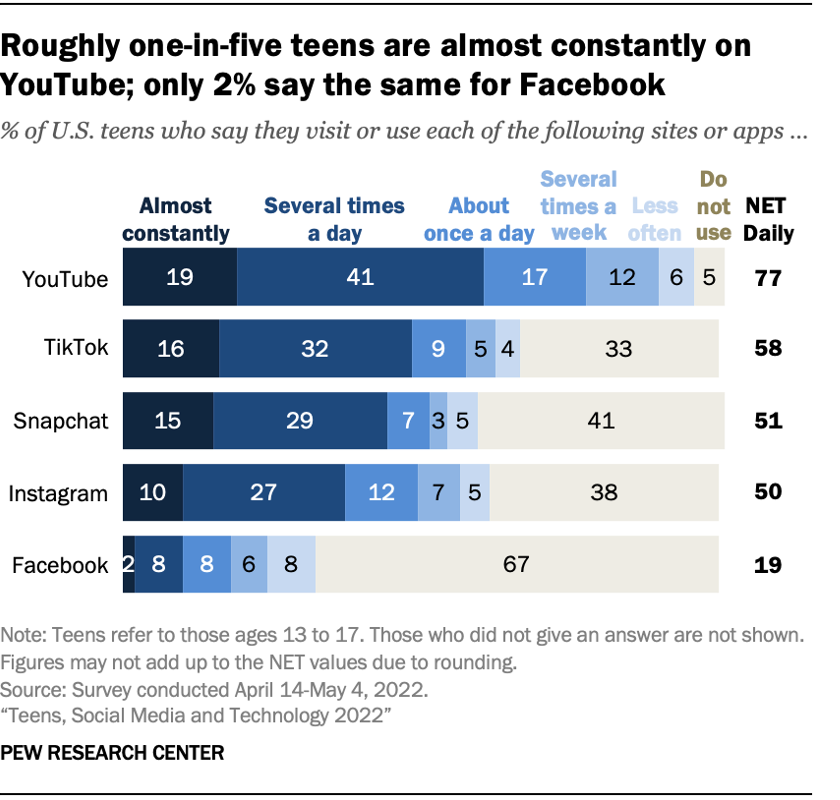
71. 16% of American teens say they use TikTok almost constantly, and another 32% use it several times per day.
72. Among all Americans aged 12+, TikTok is the third-most-popular social network (33%)
73. TikTok was the most downloaded app of any kind in 2022, with 99 million downloads in the USA and 672 million globally.
74. TikTok is available in over 150 different markets and in 35 languages.
75. 84% of TikTok users also use Facebook.
76. TikTok is the #1 social platform to look for funny or entertaining content.
77. 16% of B2B marketers used TikTok last year. This is a key example of why it’s important to stay up-to-date on the latest social media demographics and trends. Just a few years ago, B2B marketing on TikTok would have seemed highly impractical.
Read more: Check out our full post packed with TikTok statistics.
YouTube demographics
78. YouTube has 2.514 billion users worldwide.
79. The average user spends an average of five hours on the app per week.
80. More than 500 hours of content are uploaded to YouTube every minute.
81. Globally, 45.6% of Youtube users identify as female, and 54.4% identify as male.
82. 95% of U.S. teenagers use YouTube. 19% say they use it “almost constantly,” and another 41% use it several times per day.

Source: Pew Research Center
83. 2 billion logged-in YouTube users watch Shorts every month.
84. More than 150 million people in the U.S. watch YouTube on Connected TV screens.
85. 63% of B2B marketers used YouTube in the last year.
Read more: Find even more YouTube statistics to help guide your YouTube marketing strategy.
Pinterest demographics
86. Pinterest has 465 million monthly active users.
87. 60% of Pinterest’s global audience are women. The largest user group is women aged 25 to 35, who represent 28.5% of the total interest audience.
88. However, the percentage of male Pinners is increasing 40% year-over-year.
89. 31% of Americans aged 12+ use Pinterest.
90. 37% of Americans aged 12 to 34 use Pinterest, compared to 34% of Americans aged 35 to 54 and 21% of Americans aged 55+.
91. The USA has the most Pinterest users by far: It has 84.6 million users.
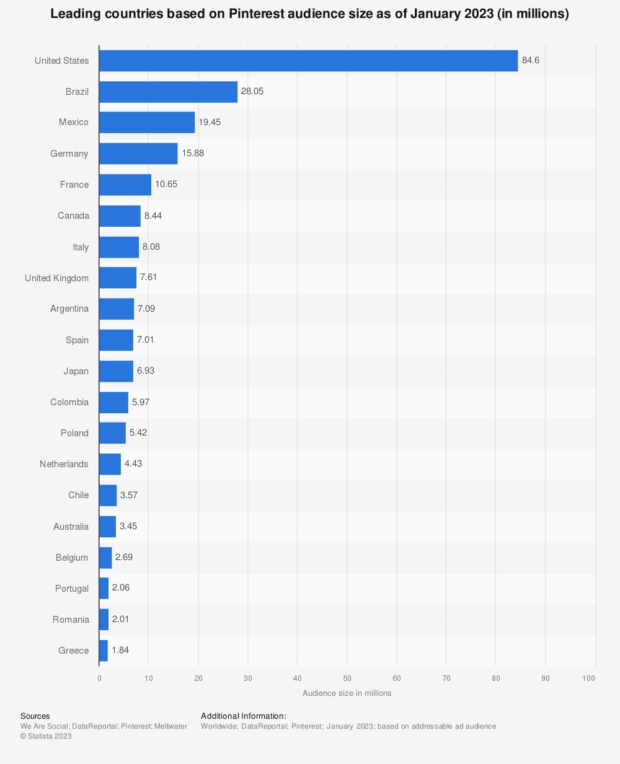
Source: Statista
92. 46% of people in Canada with a household income over $100K use Pinterest. In the U.S., 45% of those high-income households are on Pinterest.
93. Pinterest will see 16.9 million U.S. social commerce buyers in 2023.
Read more: These interesting Pinterest demographic stats can help guide your brand’s Pinterest marketing strategy.
Snapchat demographics
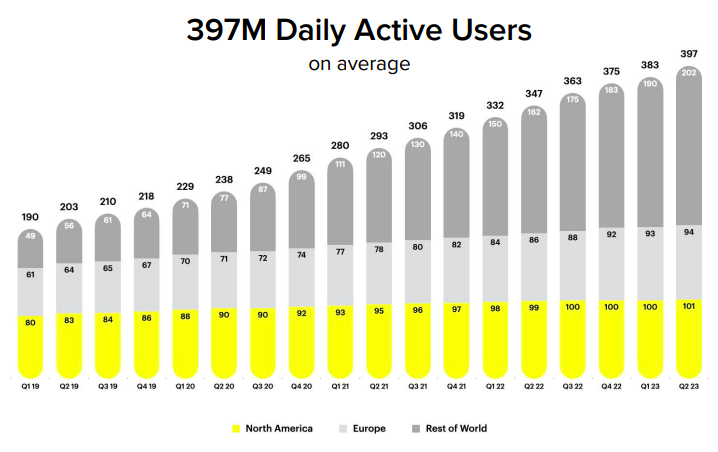
94. Snapchat has more than 750 million monthly active users.
95. 397 million people use Snapchat each day.

Source: Snap
96. The company’s internal data shows it reaches 75% of 13-to-34-year-olds in more than 20 countries, and 90% of 13-to-24-year-olds.
97. Snapchat will see the greatest user growth worldwide of all the social platforms in 2023, at 13.4%.
98. 51% of Snapchatters are female and 48.2% are male.
99. 20% of users are aged 13 to 17, and 38% are aged 18 to 24.
100. 59% of U.S. teenagers use Snapchat.
101. 51% of Americans aged 12 to 34 use Snapchat, compared to 21% of Americans aged 35 to 54 and just 5% of Americans aged 55+.
102. Snapchat has 101 million daily active users in North America, 94 million in Europe, and 202 million in the rest of the world.
103. India is the country with the largest number of Snapchat users (182 million).
104. The United States (108.8 million), Pakistan (26.35 million), and (France (25.9 million) follow India for the largest Snapchat base in the world.
105. The Snapchat+ service has 4 million subscribers.
106. More than 150 million people have used Snapchat’s My AI. They have sent a total of more than 10 billion messages.
107. More than 250 million daily active users engage with augmented reality on the platform every day.
108. More than 350 million users engage with the Snap Map every month.
109. Only 4% of B2B marketers used Snapchat last year.
Read more: Find even more details in our post on the most important Snapchat demographics for marketers.
Save time managing your social media presence with Hootsuite. From a single dashboard you can publish and schedule posts, find relevant conversions, engage the audience, measure results, and more. Try it free today.
Get Started
Do it better with Hootsuite, the all-in-one social media tool. Stay on top of things, grow, and beat the competition.
The post 109 Social Media Demographics Marketers Need to Know in 2023 appeared first on Social Media Marketing & Management Dashboard.


